Agreement monitoring
Encode the limits in an agreement, like caps on new disturbance, linear limits and setbacks, and see how much of each is used and what's left. Every result cites the clause it comes from.
REIA / Products / REIA Cumulative Effects
REIA Cumulative EffectsBeta, December 2026
REIA Cumulative Effects measures how much of a territory is near disturbance, how cut up the remaining land is, and which old disturbances matter most to reclaim. It runs on your own hardware, from public data first.
In Yahey v. British Columbia (2021), the court found that decades of authorized development, taken together, had infringed Treaty rights. No single permit was the problem. The total was. Nations now need their own evidence of what development adds up to, measured their way and kept in their hands.
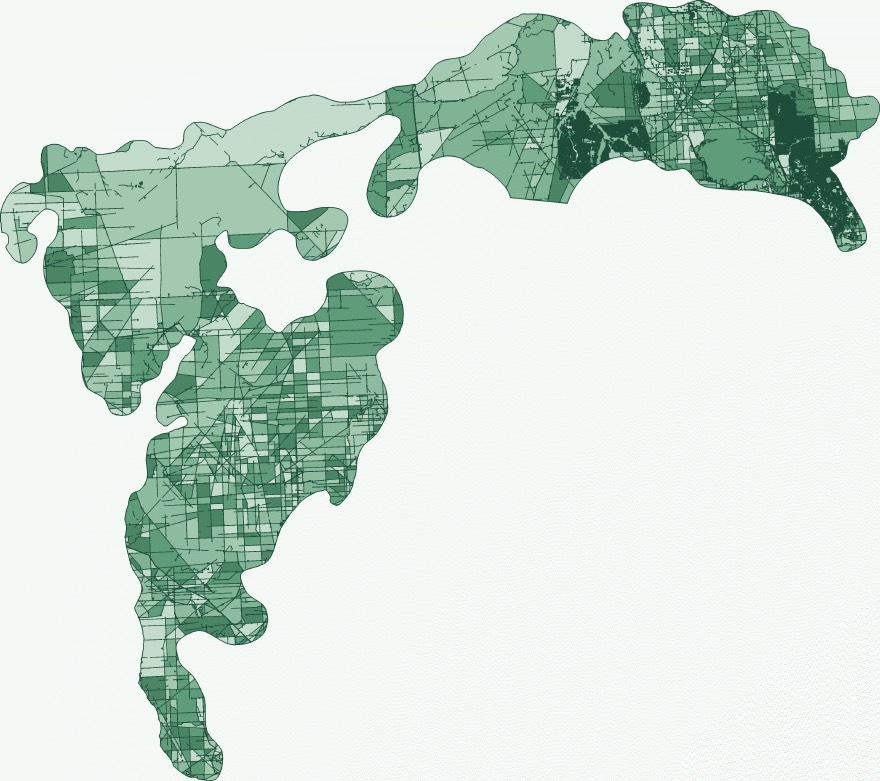
Governments usually report the share of land near disturbance. Once most land is near something, that number barely changes, even when new development cuts the last connected habitat. REIA reports it too, at 250 m and 500 m, and adds connectivity: how likely it is that two points on the land are still in the same unbroken patch. It comes from a published measure called effective mesh size (Jaeger, 2000).
The share of your territory near mapped industrial disturbance, with overlaps counted once.
How cut up the remaining land is, mapped patch by patch.
Which single old road or seismic line would bring back the most connected land if it were reclaimed.
Drop in a proposed project and see what it changes, before you respond.
Every result comes with a report you can export, and a run record listing every source, date and setting.
Not every old cut is equal. A dead-end spur barely matters. A line through the middle of a large patch can cut it in half. REIA ranks every feature by how much connected land would return if it were reclaimed, so restoration money goes where it changes the most.
Upload the footprint from a referral, or draw it. REIA shows what your territory looks like before, after and the change, at both buffer distances and for connectivity. Sometimes the answer is that a project changes very little, and that's worth knowing too.
| Measure | Before | After | Change |
|---|---|---|---|
| Within 250 m | 58.0% | 58.6% | +0.6 pts |
| Within 500 m | 81.0% | 81.5% | +0.5 pts |
| Connected | 4.0% | 3.2% | −0.8 pts |
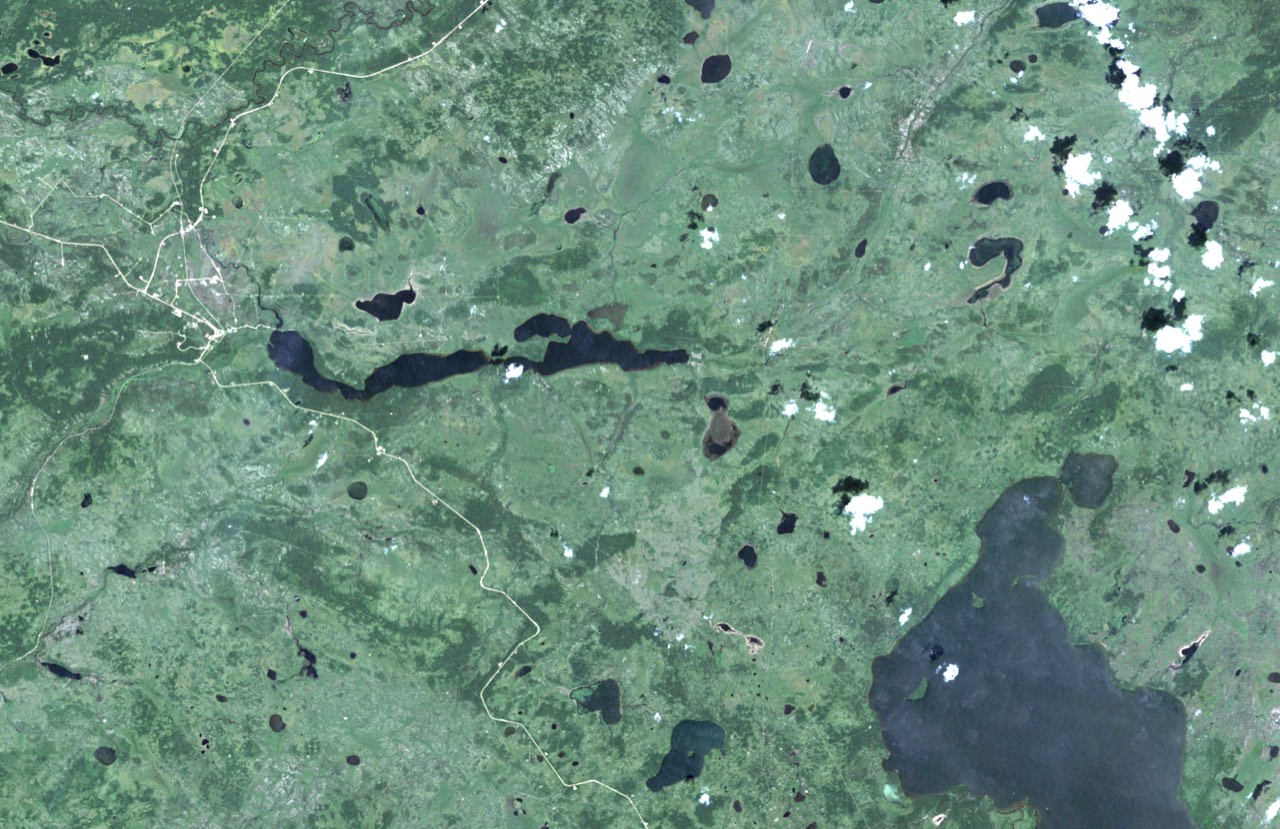
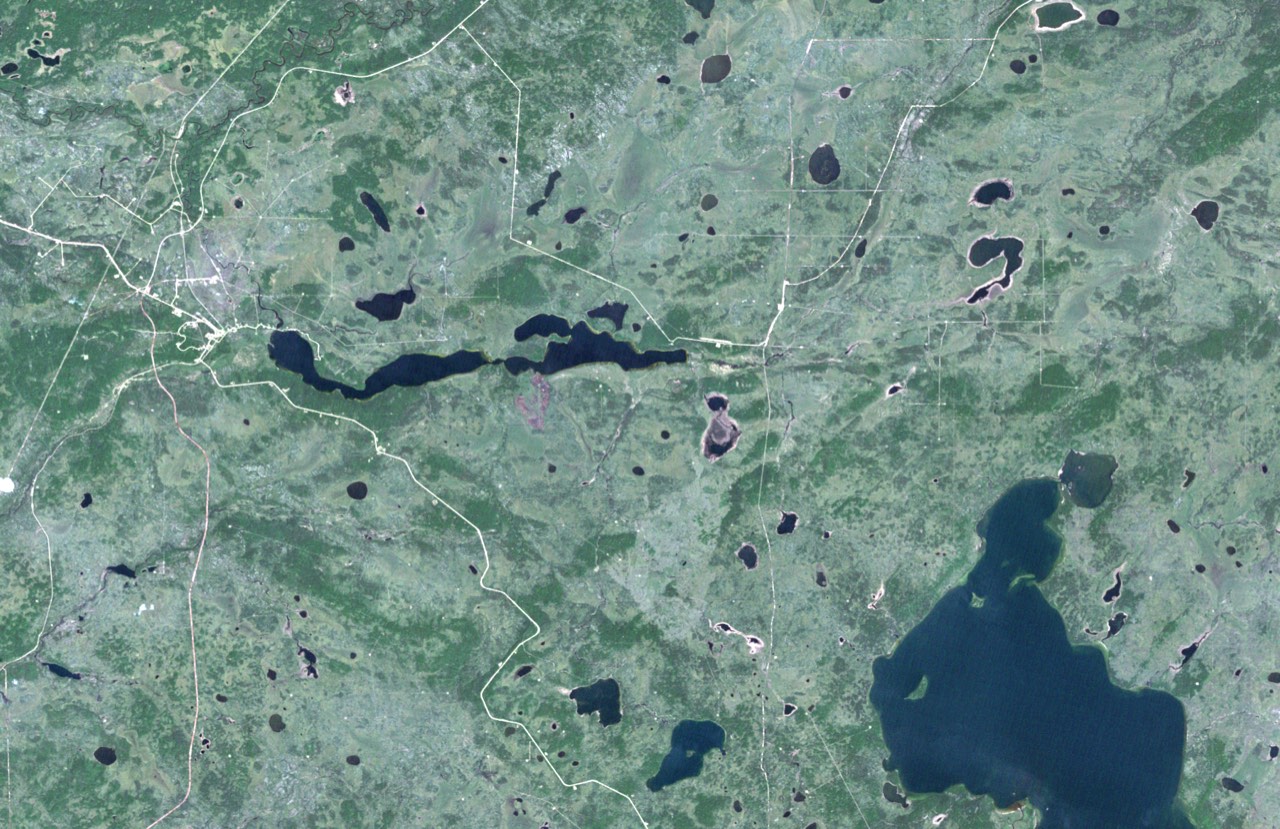
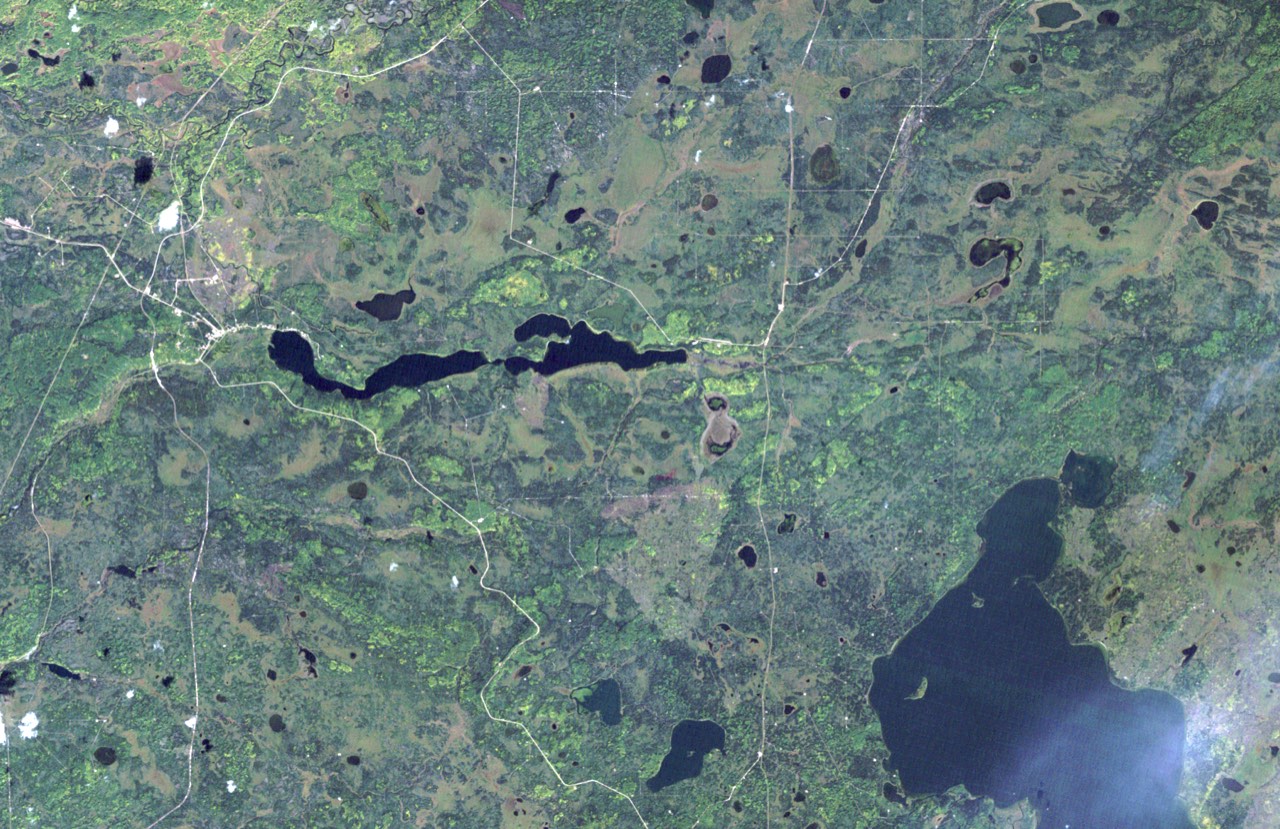
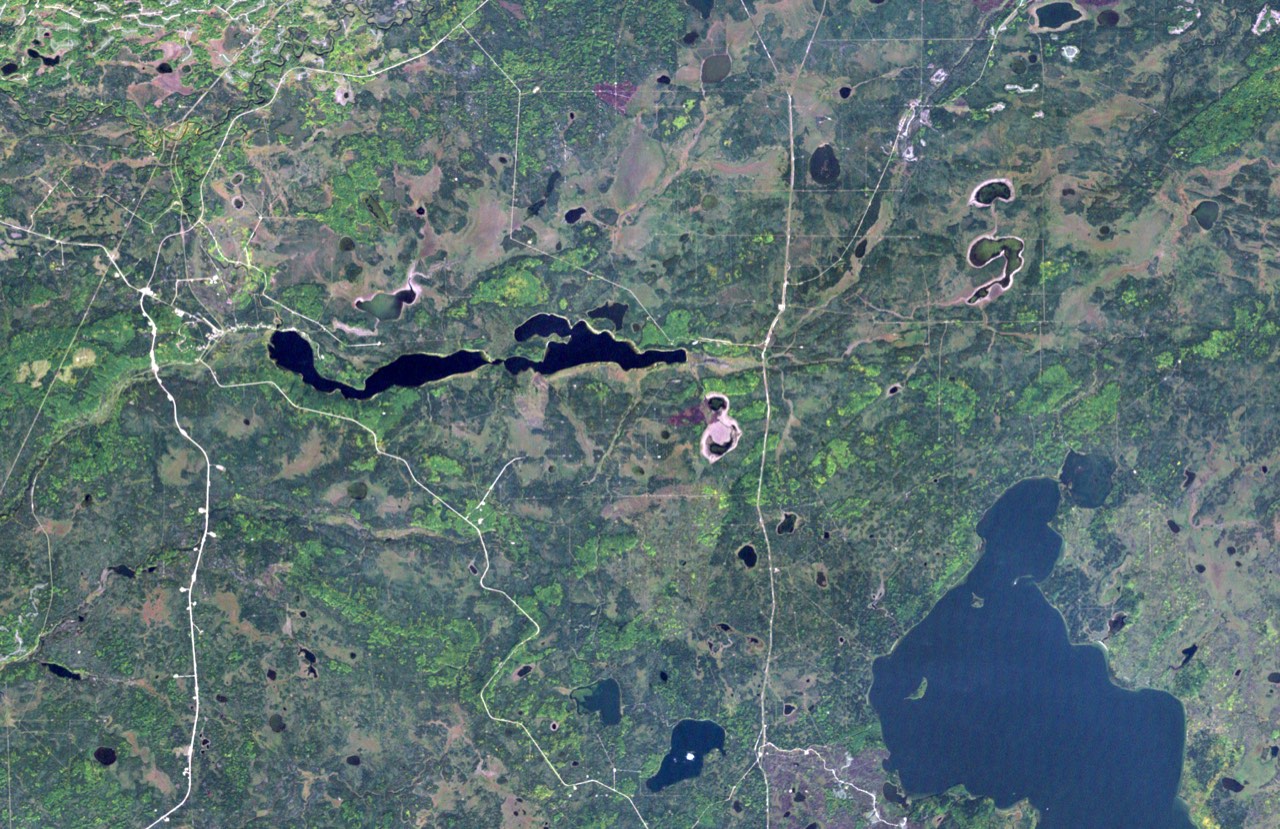
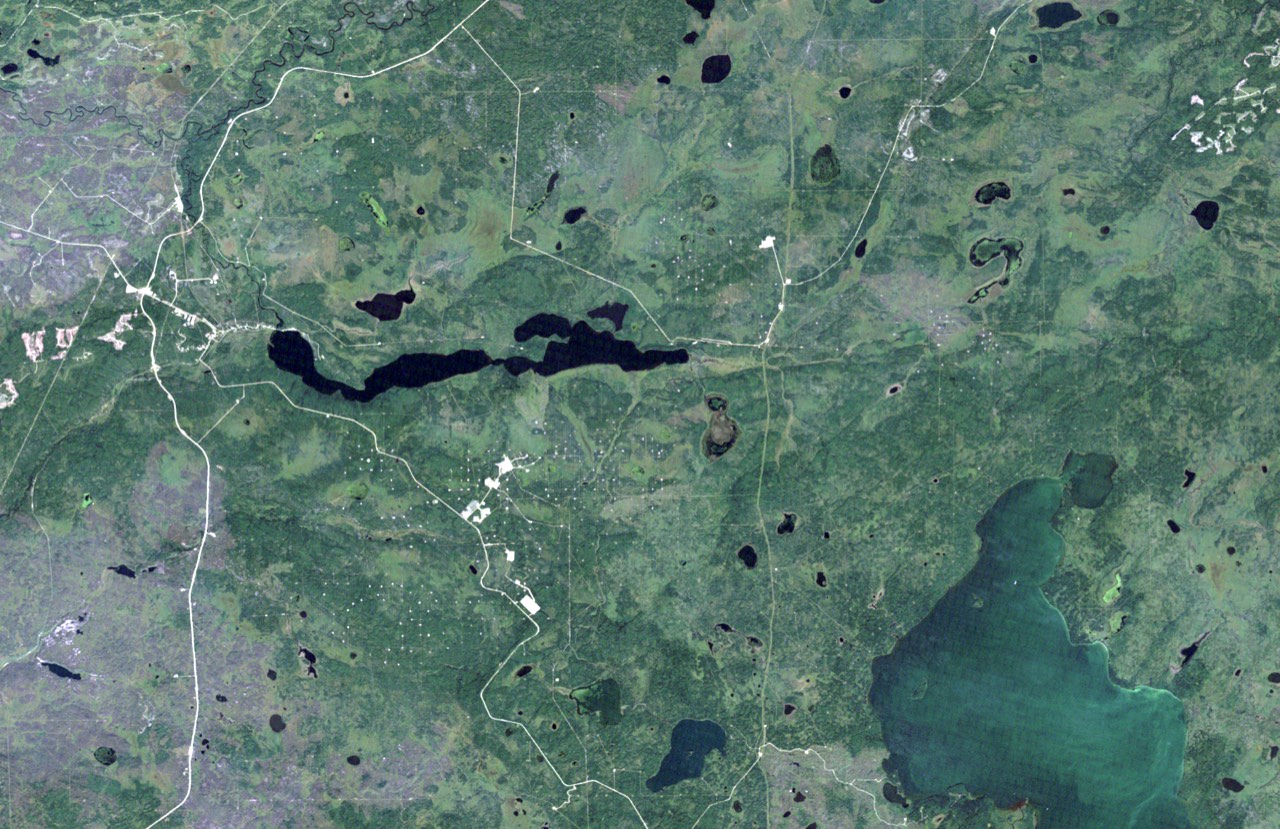
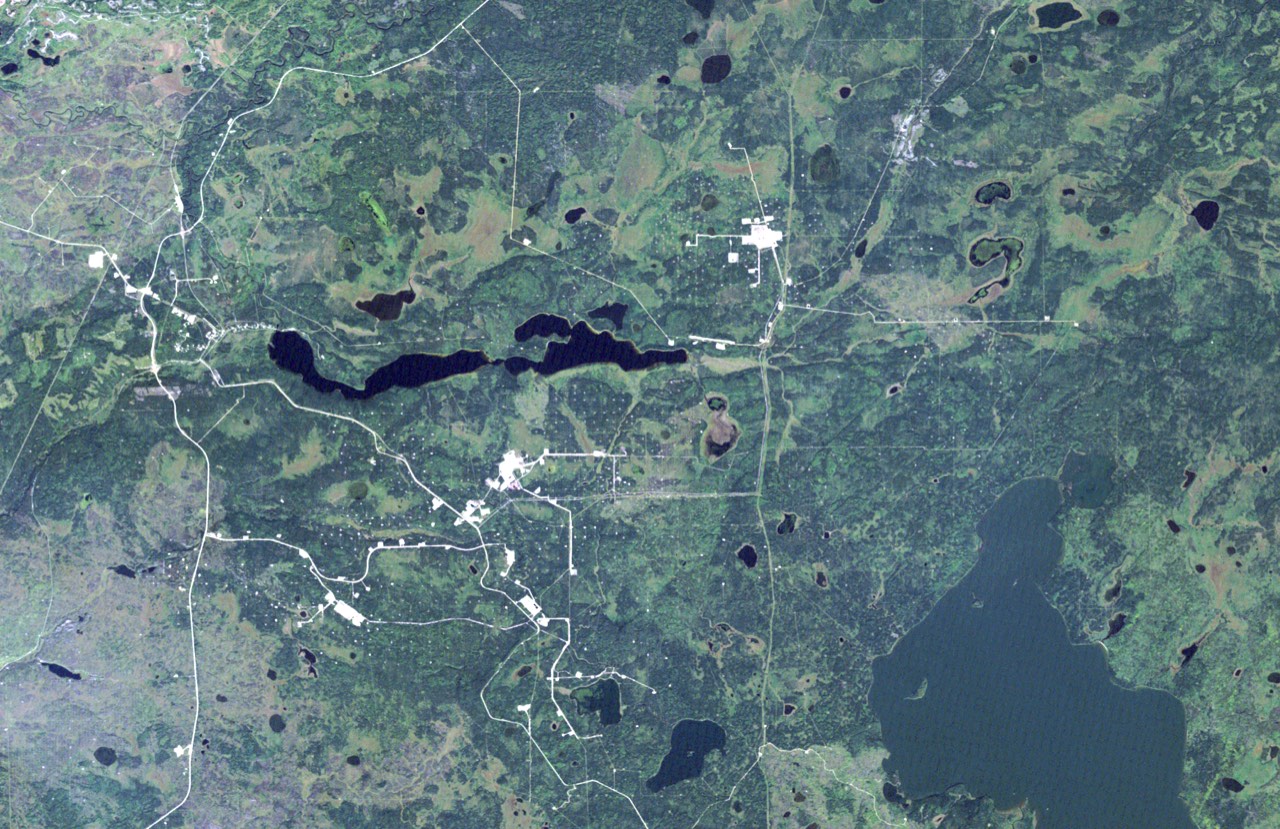
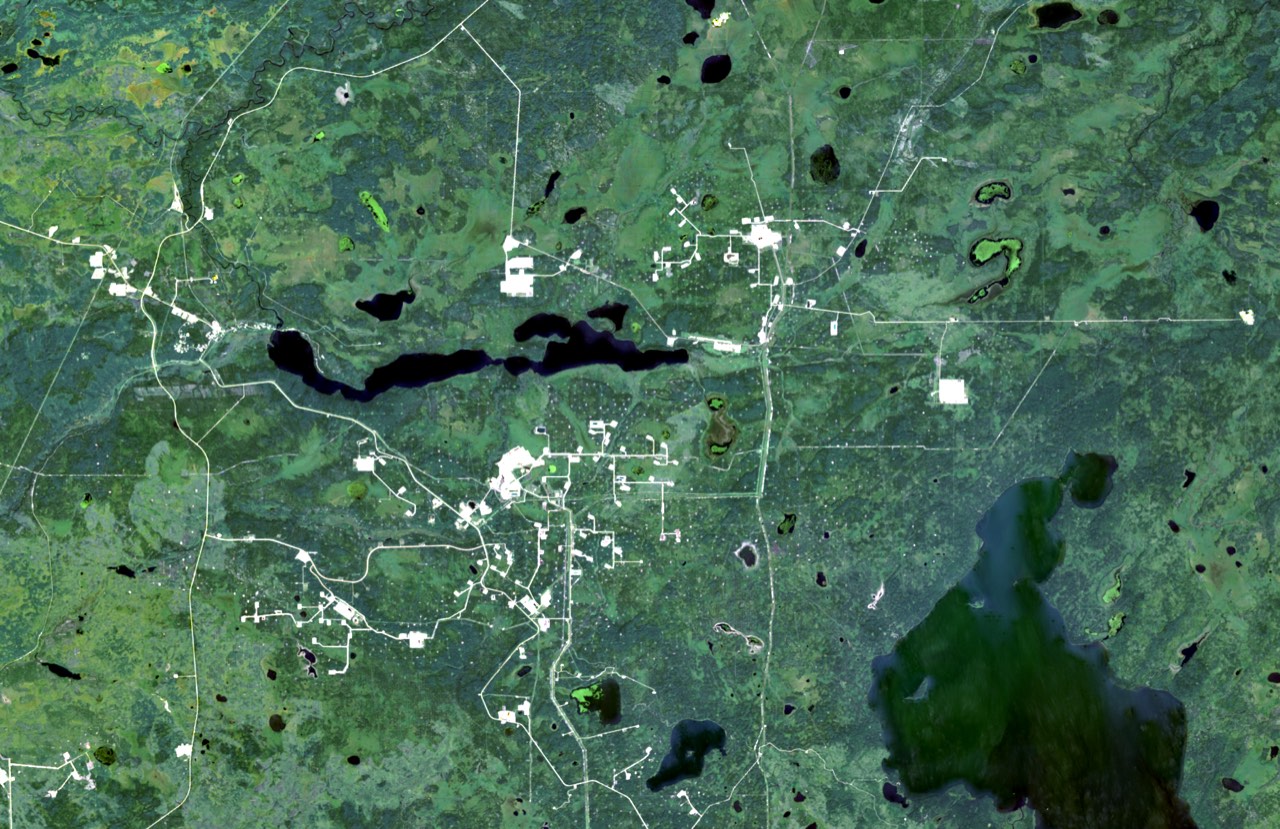
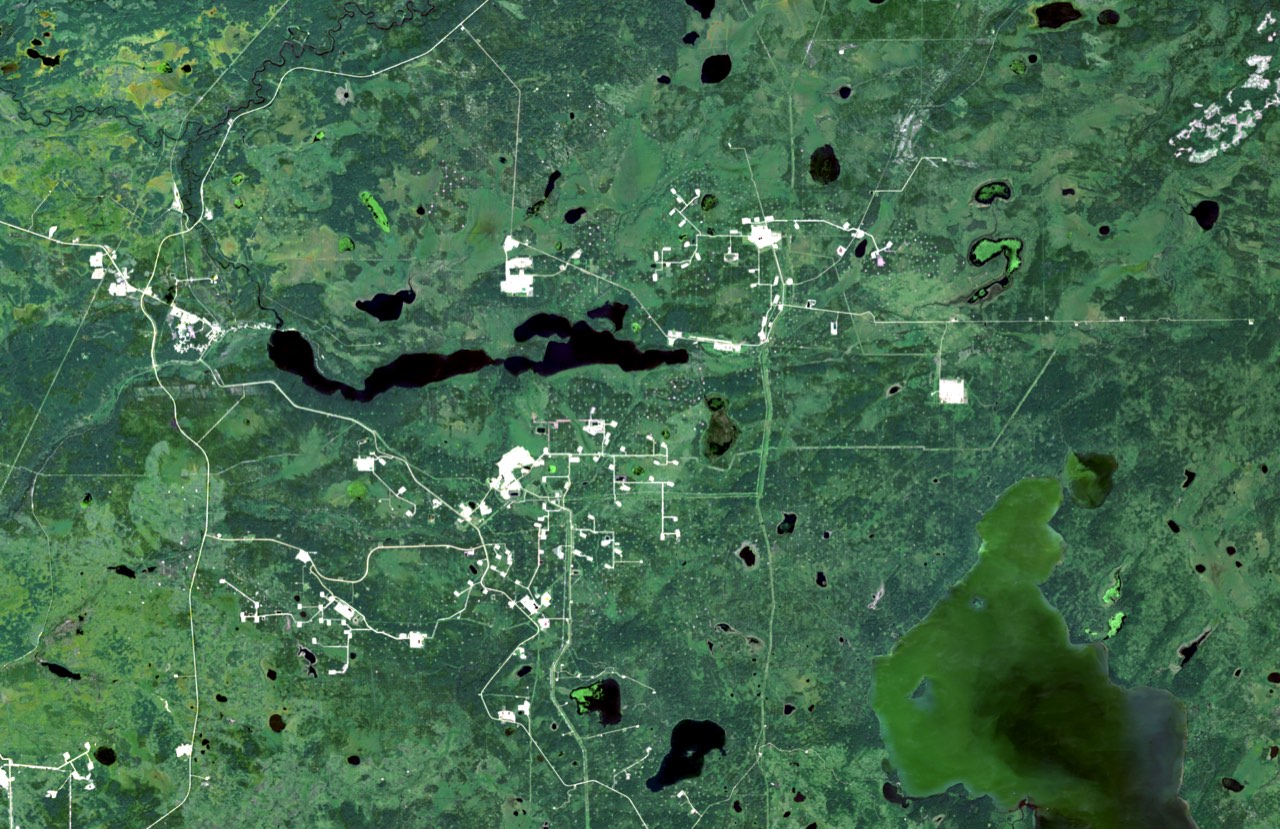
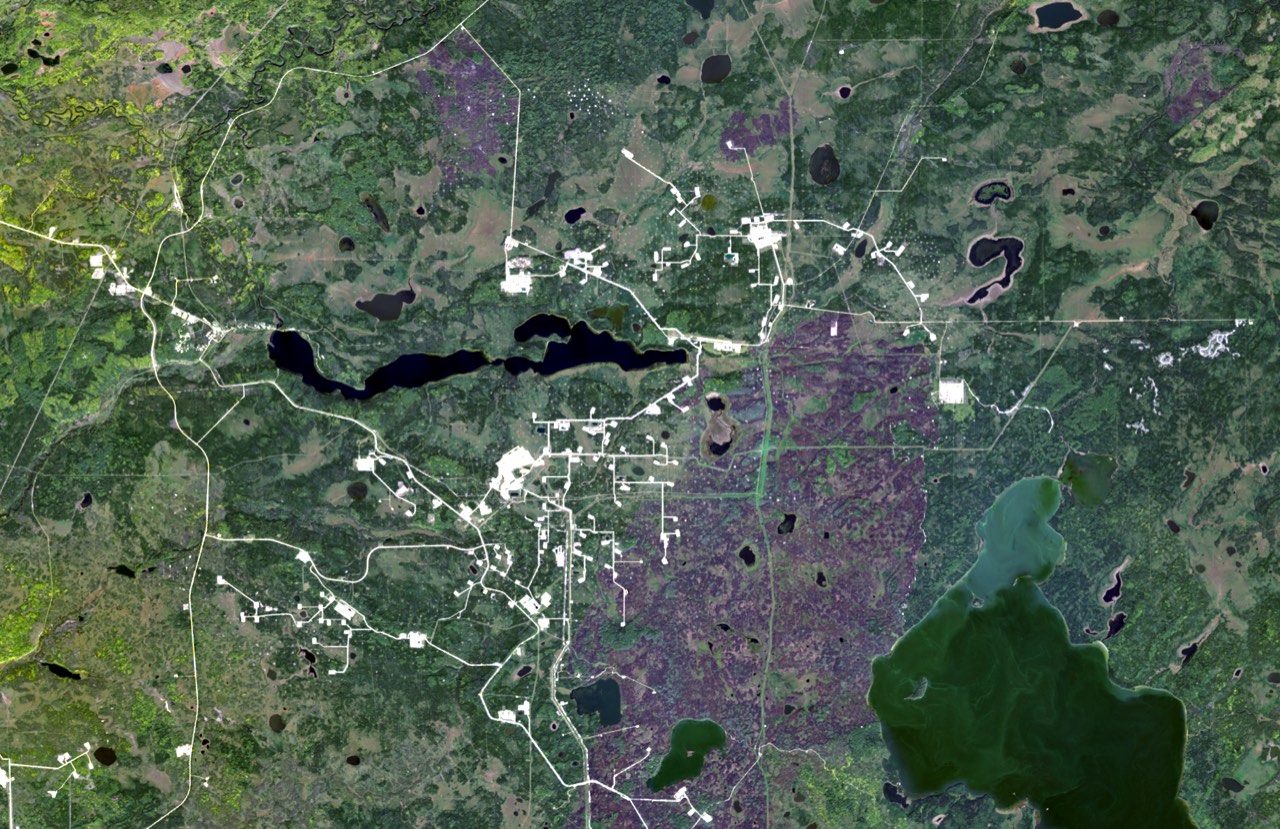
The same 54 by 35 km around Christina Lake, Alberta, from 1985 to 2025. Roads and industrial clearings appear, one approval at a time.
This is a public satellite record of a place. It is not a map of any Nation's territory, and it is not an output of REIA Cumulative Effects.
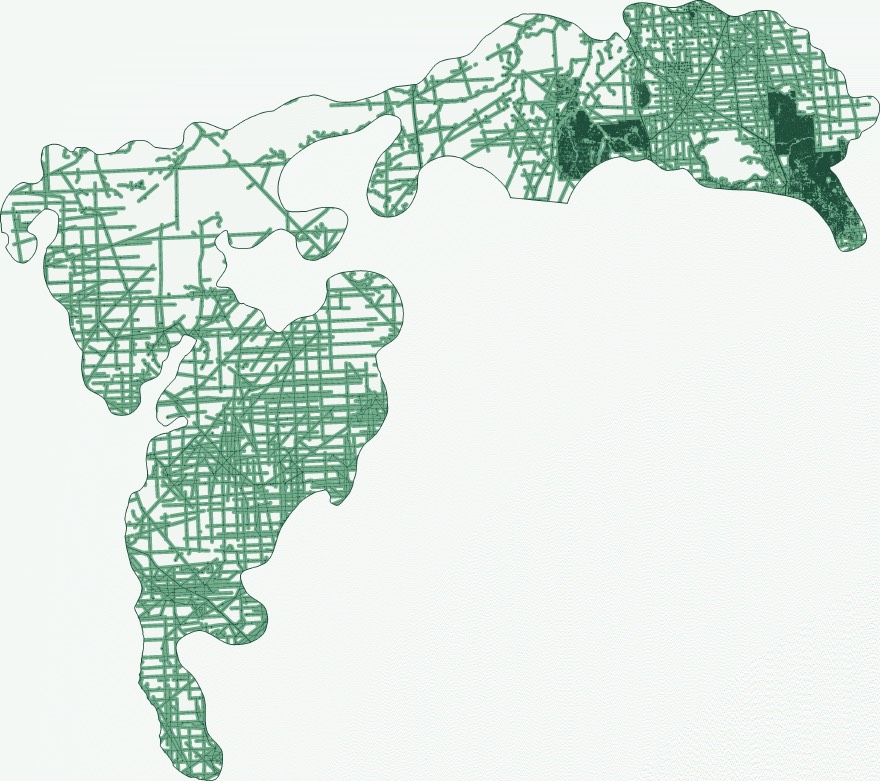
We tested the engine on the Algar caribou range sub-unit, a published Government of Alberta boundary of about 3,300 km² that nobody at REIA drew. Every number reproduces from the run record, and the restoration ranking matches a full recompute to within 0.002 km².
| Measure | Result | How firm |
|---|---|---|
| Share within 250 m of disturbance | About 60% | Stable across raster resolutions |
| Chance two points are still connected | 1 to 2% | Approximate, depends on resolution |
| Best single reclamation | One 5.5 km seismic line, restoring roughly a third to a half of remaining connectivity | Same line ranked first at 10 m and 30 m |
| Newest issued, not yet drilled well licence | No measurable change | Exact |
Present-day snapshot from public Crown data. Absolute connectivity values depend on resolution, so percentages, changes and rankings are the reliable outputs.
Encode the limits in an agreement, like caps on new disturbance, linear limits and setbacks, and see how much of each is used and what's left. Every result cites the clause it comes from.
Add pending applications to what's already there, and see the year each of your thresholds would be crossed at the current rate, and which projects drive it.
Totals across several Nations' territories without pooling anyone's data. Each Nation shares only the totals it chooses to.
Every check produces a report written for people without a GIS background. It covers what was measured, the results with a plain sentence on what each means, the top places to reclaim, any referral change, the full list of sources, and the limits.
Answer referrals with your own numbers.
See the whole territory, not one permit at a time.
Know where to look on the ground.
Public provincial disturbance layers, roads, cutlines, wells and licences first. Your own layers only if you choose to add them.
The BC southern interior, northeast BC and Alberta at launch.
No. The report is written for non-specialists, and training is part of every engagement.
The core measurements are standard, published geospatial methods, so anyone can check them. Machine learning is used separately for detecting change in imagery, and is labelled where it is.
Every number can be reproduced from its run record, and the methods are published, so a qualified expert can check and stand behind them. Whether evidence is accepted is for a court or decision-maker to decide.
We'll run the territory check on public data for your area and walk your lands office through it before anything of yours is loaded.