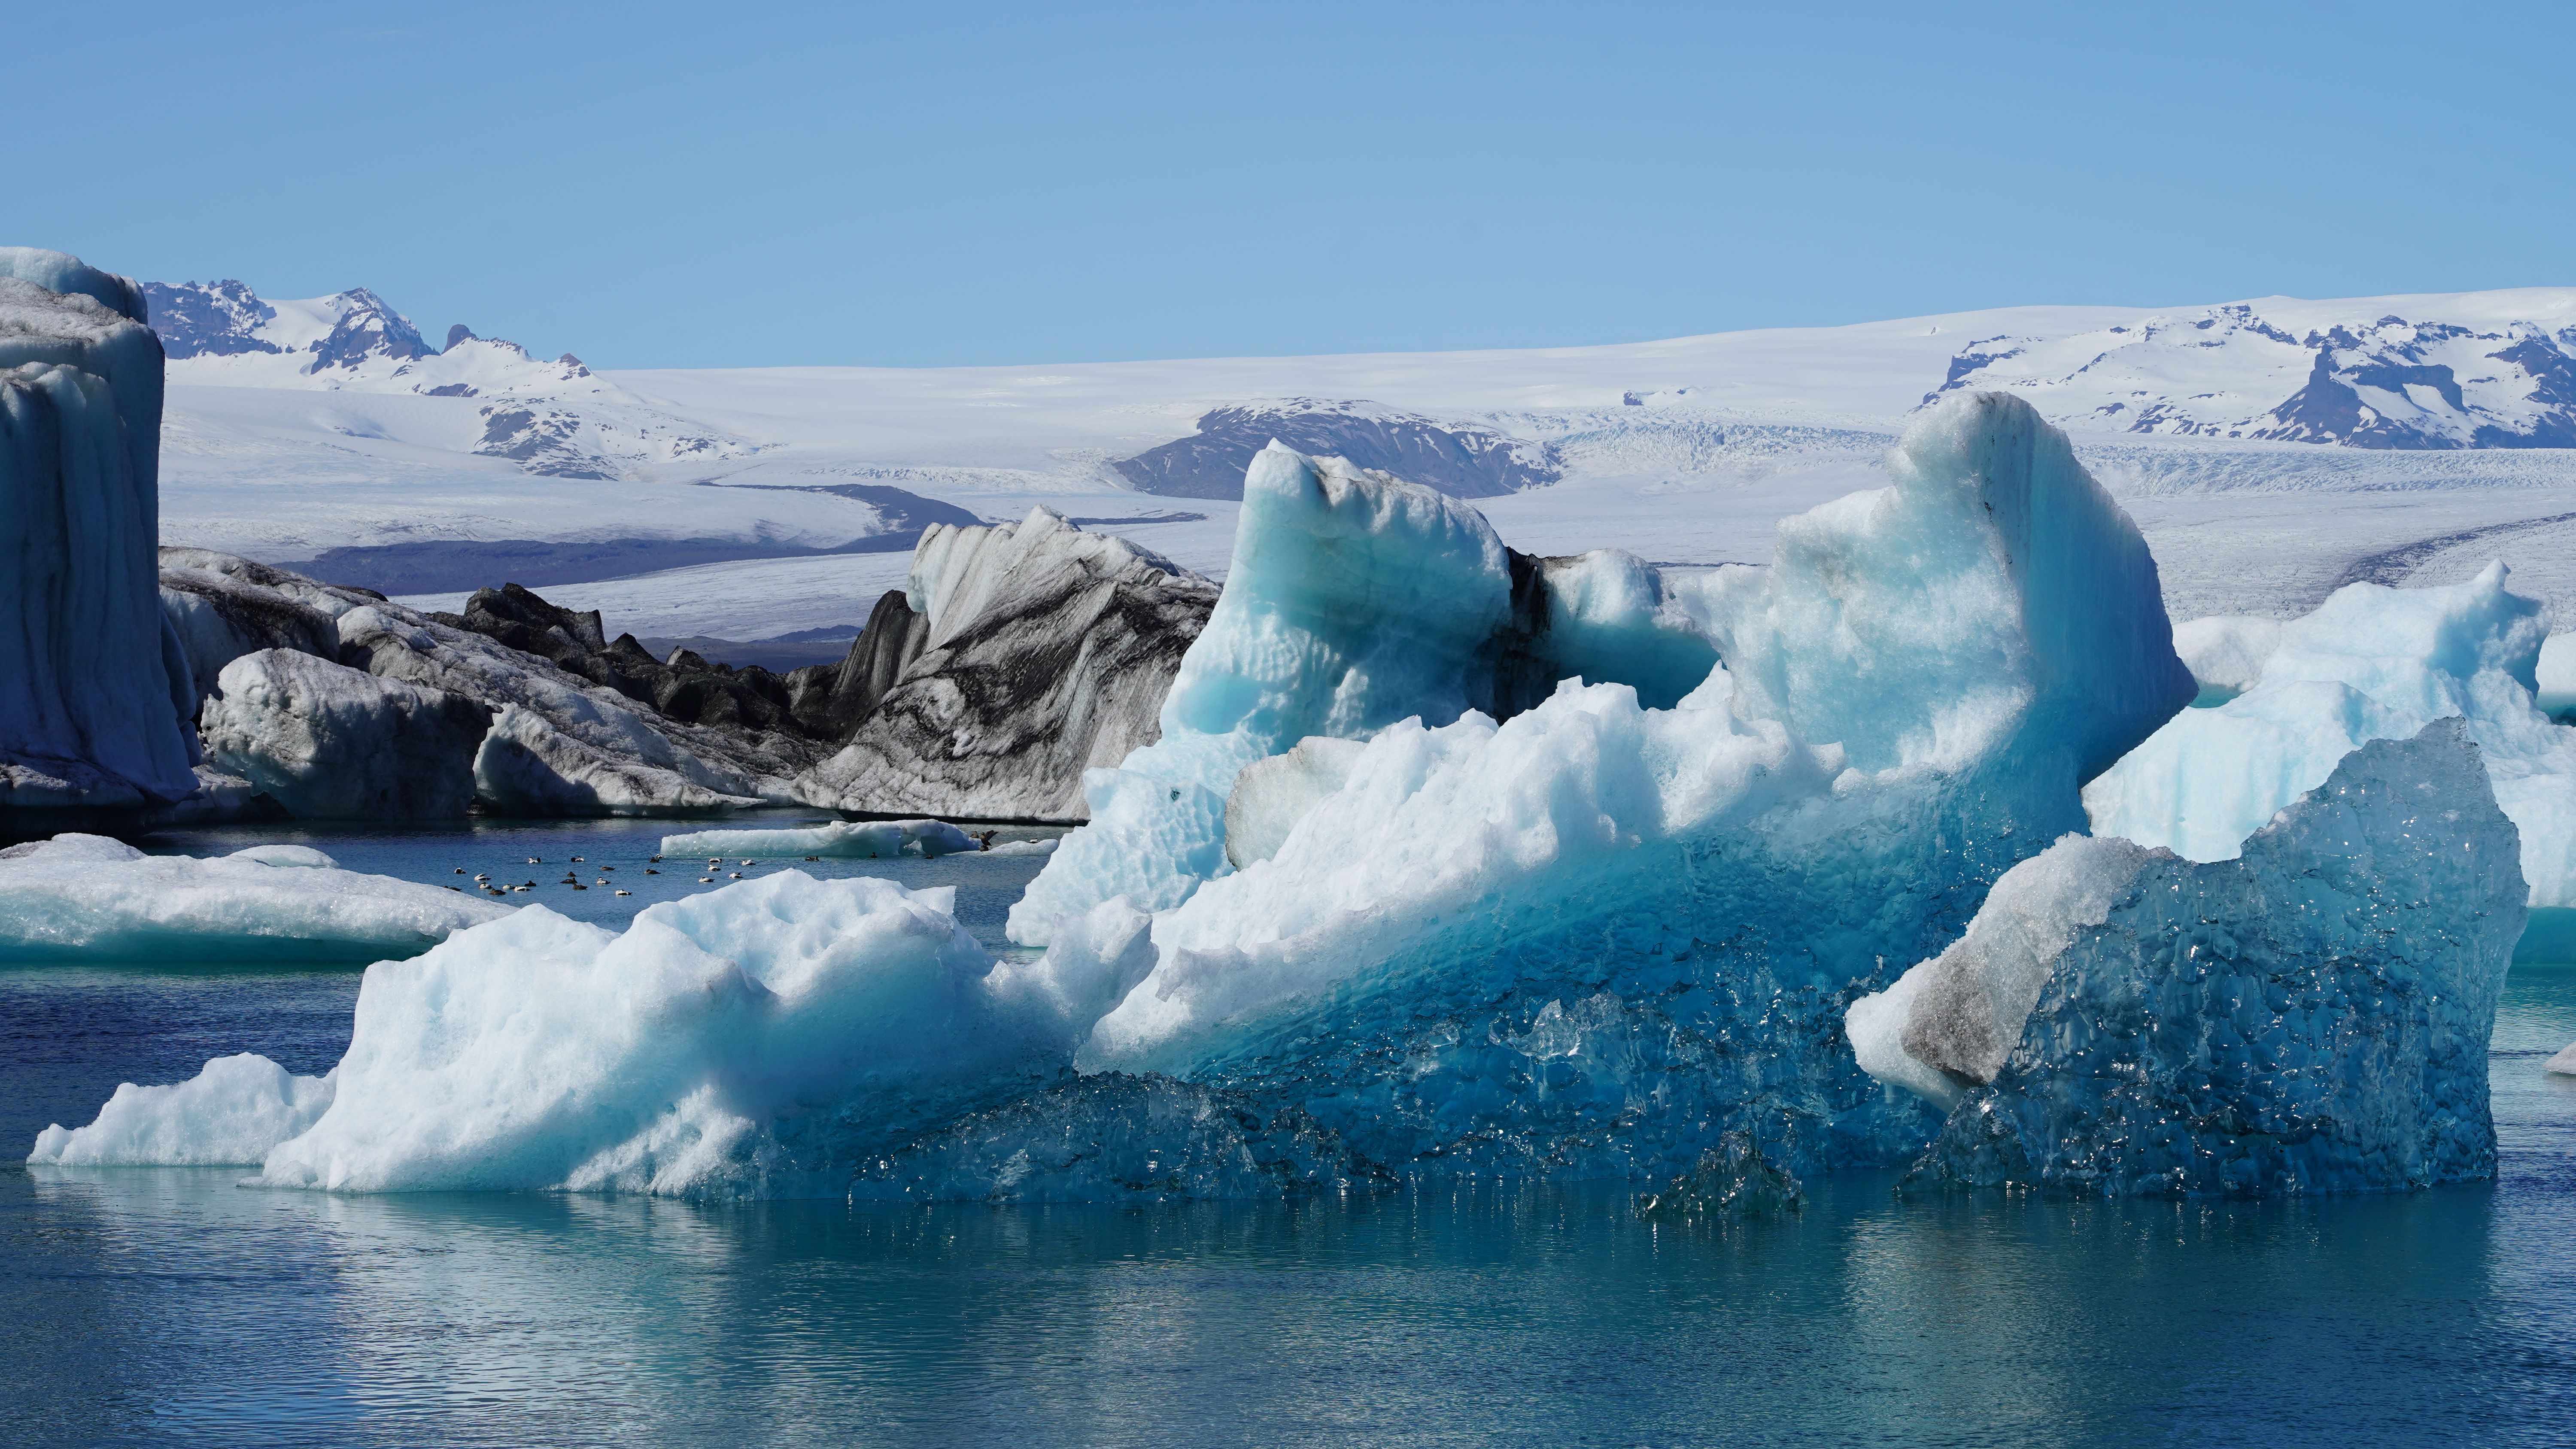
Blue glacial ice floating in Arctic water beneath a broad icefield

REIA  /  The Arctic

The fastest changing place in Canada, and the least watched.

Inuit Nunangat covers forty percent of Canada's land area and seventy-two percent of its coastline. The ice, the ground and the shore are all moving, and the monitoring infrastructure is thinner here than anywhere else in Canada.

No Inuit organisation has partnered with us yet. This page is the case we would bring to one. Where this stands

Sea ice
12%
September minimum lost per decade, 1979 to 2025
The record
19 of 19
The 19 lowest minimums on record all fall in the last 19 years
Warming
The global rate of warming, in the Canadian Arctic since 1970
Coastline
4.5 m+
Coastal erosion per year in parts of the Northwest Territories
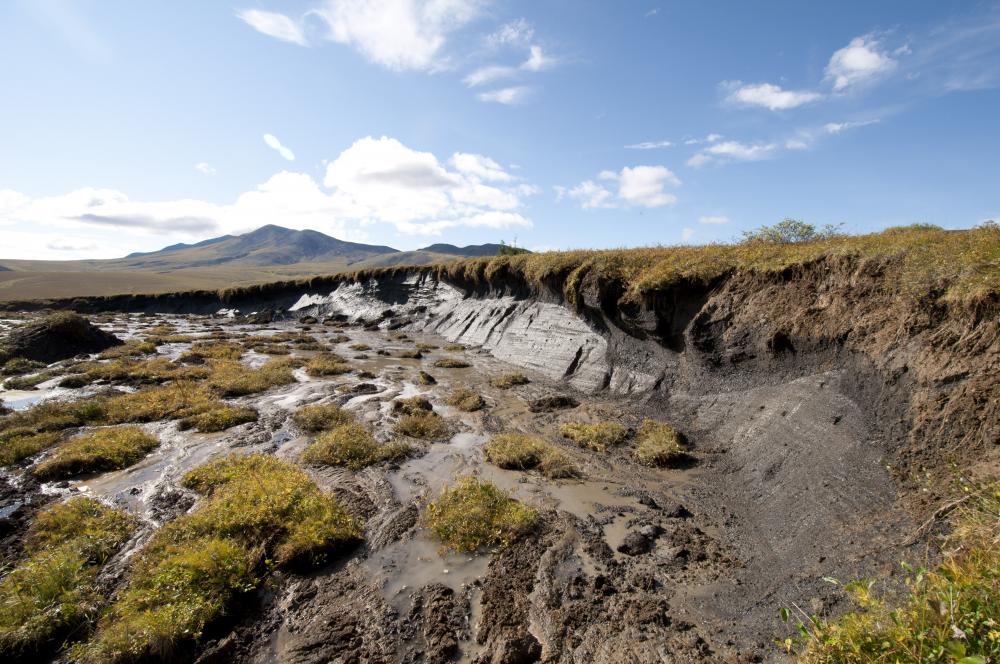
A thaw slump on Arctic tundra: a collapsed bank of dark, ice-rich soil below a lip of grass, with mud and broken turf spilling across the ground in front A thaw slump. As ice-rich permafrost thaws, the ground collapses and the exposed face retreats a little further every summer.

What is happening

Three things are moving at once, and they compound.

Each of these would be a serious problem alone. Together they change what is possible to build, to travel on, and to eat.

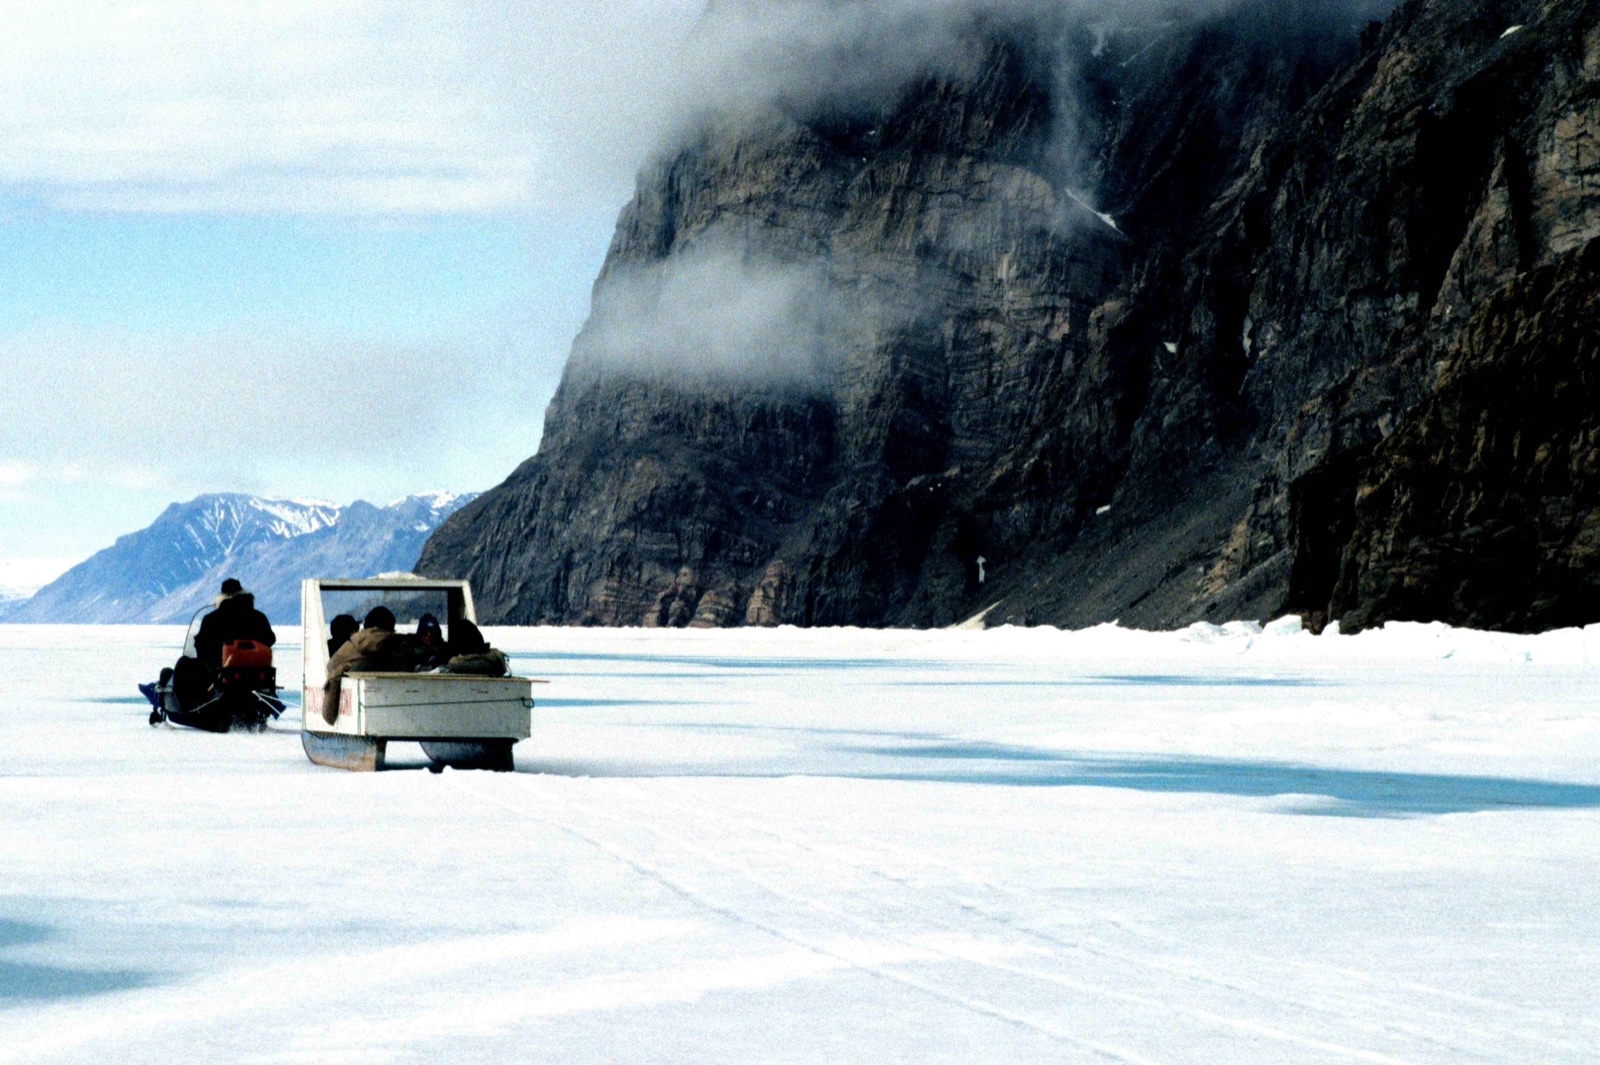
Ice A snowmobile towing a covered sled across flat sea ice below a dark sea cliff on Bylot Island, Nunavut Bylot Island, Nunavut

The ice is thinner, later, and less trustworthy

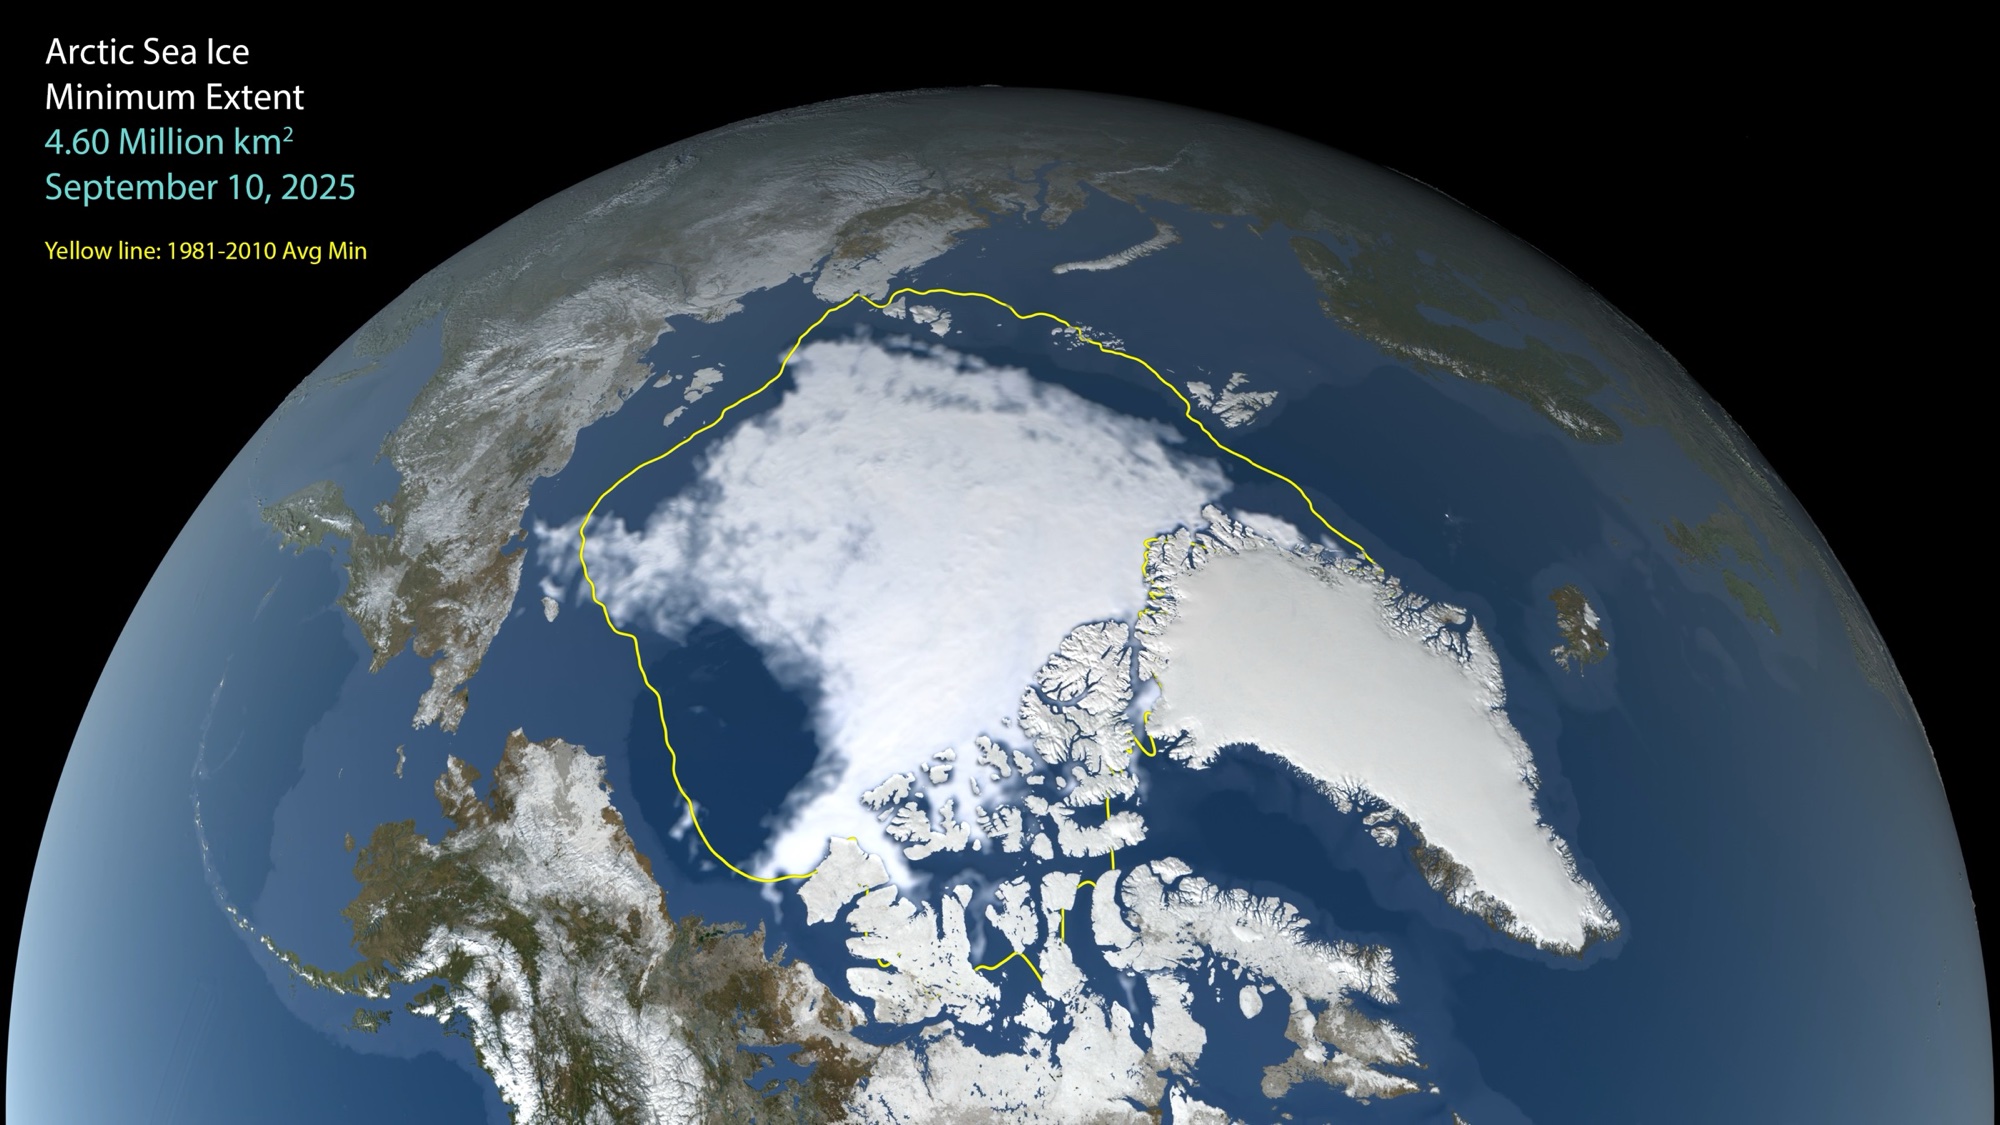
The September low point of Arctic sea ice has shrunk by about 12 percent per decade since satellite records began in 1979. The nineteen lowest minimums ever measured have all occurred in the last nineteen years.

The Canadian record says the same thing closer to home. Between 1968 and 2024, summer sea ice in northern Canadian waters shrank by about 7 percent per decade, from around 2 percent a decade in Kane Basin to 15 percent in the northern Labrador Sea. For every additional degree of global warming, Arctic waters that freeze seasonally are projected to stay ice-free about a month longer each year.

For a community, that is not an abstraction about polar bears. Sea ice is road, hunting platform and highway. Freeze-up arriving later and break-up earlier shortens the season when travel between places is possible at all, and ice that behaves differently than it did a generation ago makes inherited knowledge about where it is safe to cross less reliable exactly when it is most needed.

NSIDC satellite recordTravel safetyFood security
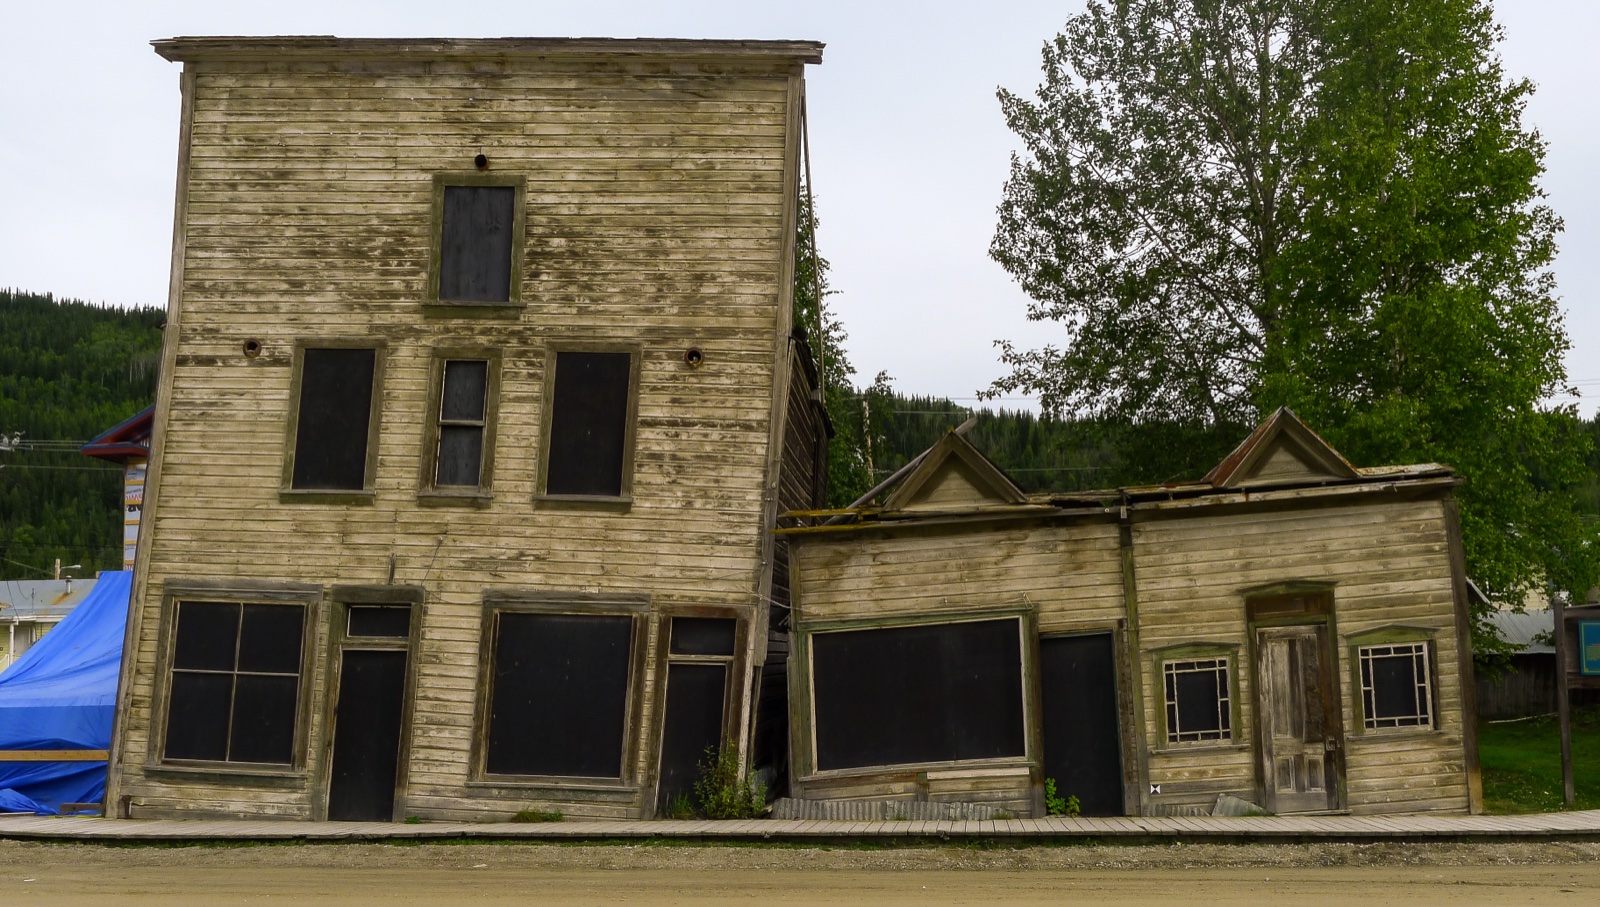
Ground Two old wooden buildings leaning into each other on ground that has shifted as permafrost thawed, Dawson City, Yukon Dawson City, Yukon

Permafrost thaw moves the ground under everything

The Canadian Arctic has warmed three times as fast as the global average since 1970. Ground that has been frozen for millennia is thawing, and it does not settle evenly. It slumps, opens sinkholes, and drains lakes.

Northern buildings, roads, airstrips, tank farms and water lines are all engineered on the assumption that the ground stays frozen. When that assumption fails, foundations crack, roads collapse in sections, and the damage often falls outside what insurance covers. Community members in Nunavik describe drywall splitting around windows and stretches of road giving way.

Some of this is already counted from space. On Banks Island, researchers working through thirty years of satellite images found active thaw slumps multiplying sixty-fold, from 63 in 1984 to 4,077 in 2013. In Iqaluit, runways and taxiways cracked and warped by thawing ground had to be dug up and rebuilt as part of the airport's upgrade.

ThermokarstInfrastructureInSAR subsidence
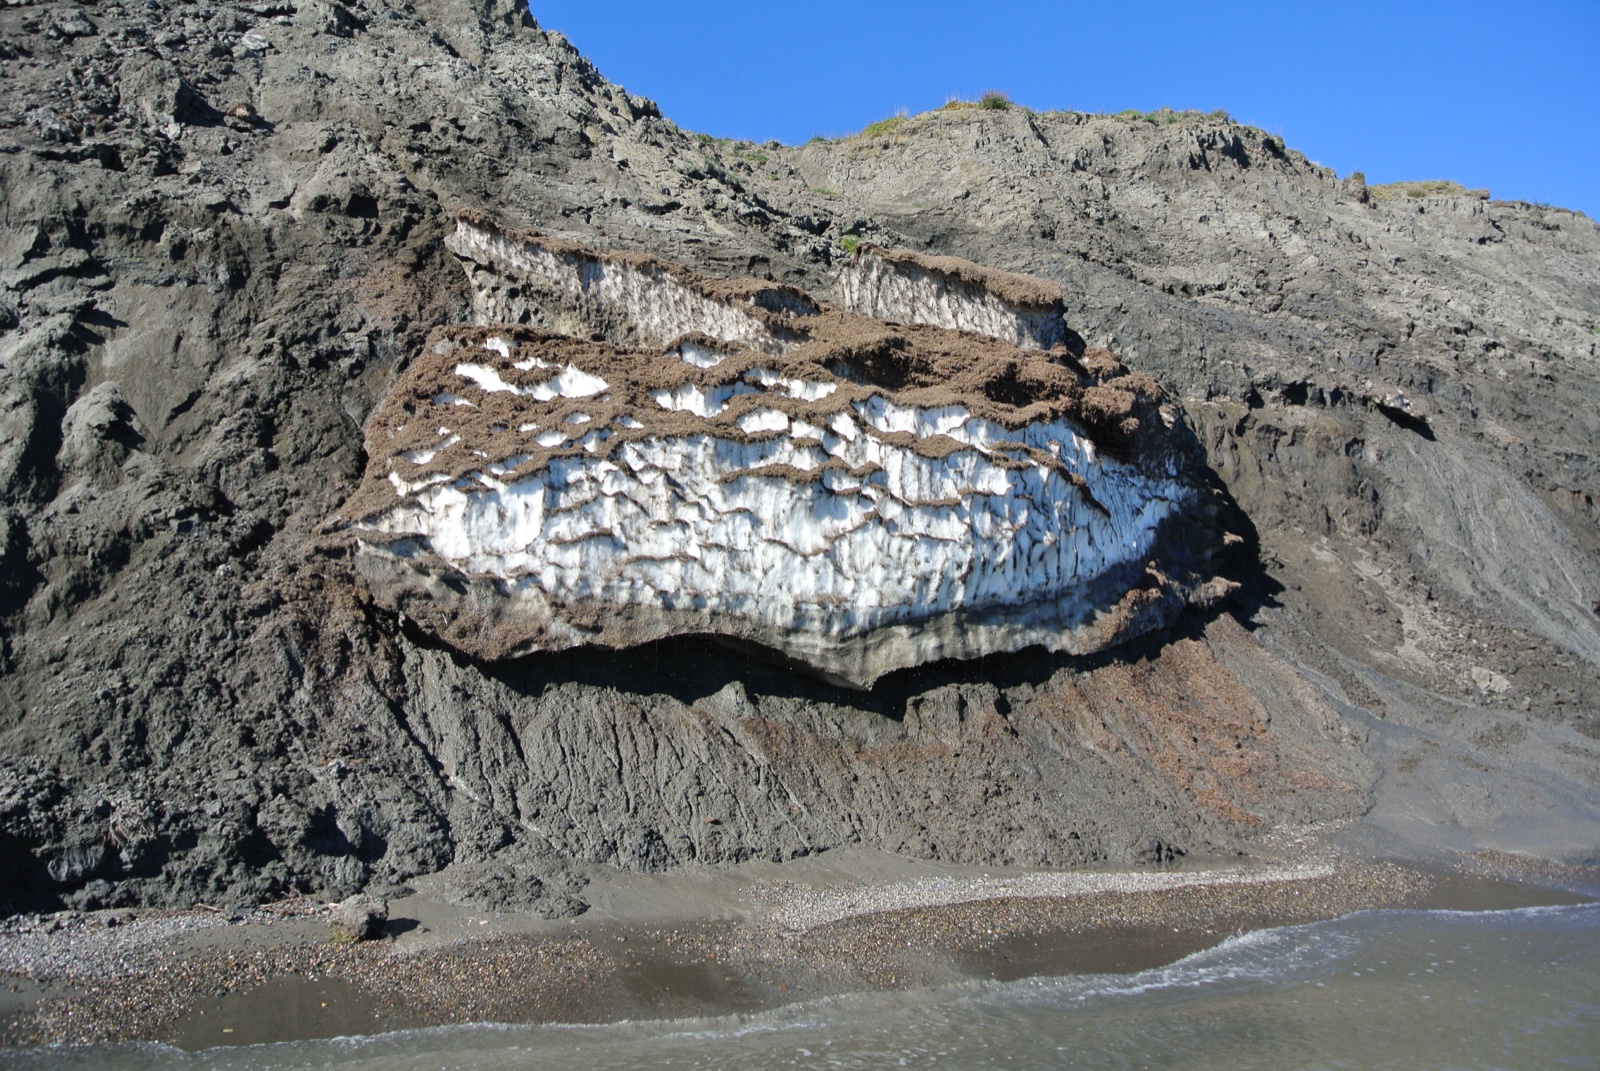
Coast An eroding coastal bluff with a thick band of white ground ice melting out above the beach, Qikiqtaruk (Herschel Island), Yukon Qikiqtaruk (Herschel Island), Yukon

The shoreline is retreating, in places by metres every year

Less sea ice means more open water, which means bigger waves reaching a coastline made partly of ice. Some communities in the Northwest Territories already see more than four and a half metres of coast lost a year, among the fastest rates in the Arctic. Tuktoyaktuk is the best known case in Canada, but it is not alone.

What erodes is not empty land. It is houses, cemeteries, archaeological sites and the ground communities were built on, at a rate that outpaces any planning cycle designed for the south.

Coastal retreatCultural sitesRelocation planning
Globe centred on the Arctic showing sea ice at its September 2025 minimum, well inside a yellow line marking the 1981 to 2010 average minimum
Arctic sea ice at its 2025 low point, 4.60 million km² on September 10. The yellow line is the 1981 to 2010 average. Visualization: NASA's Scientific Visualization Studio.
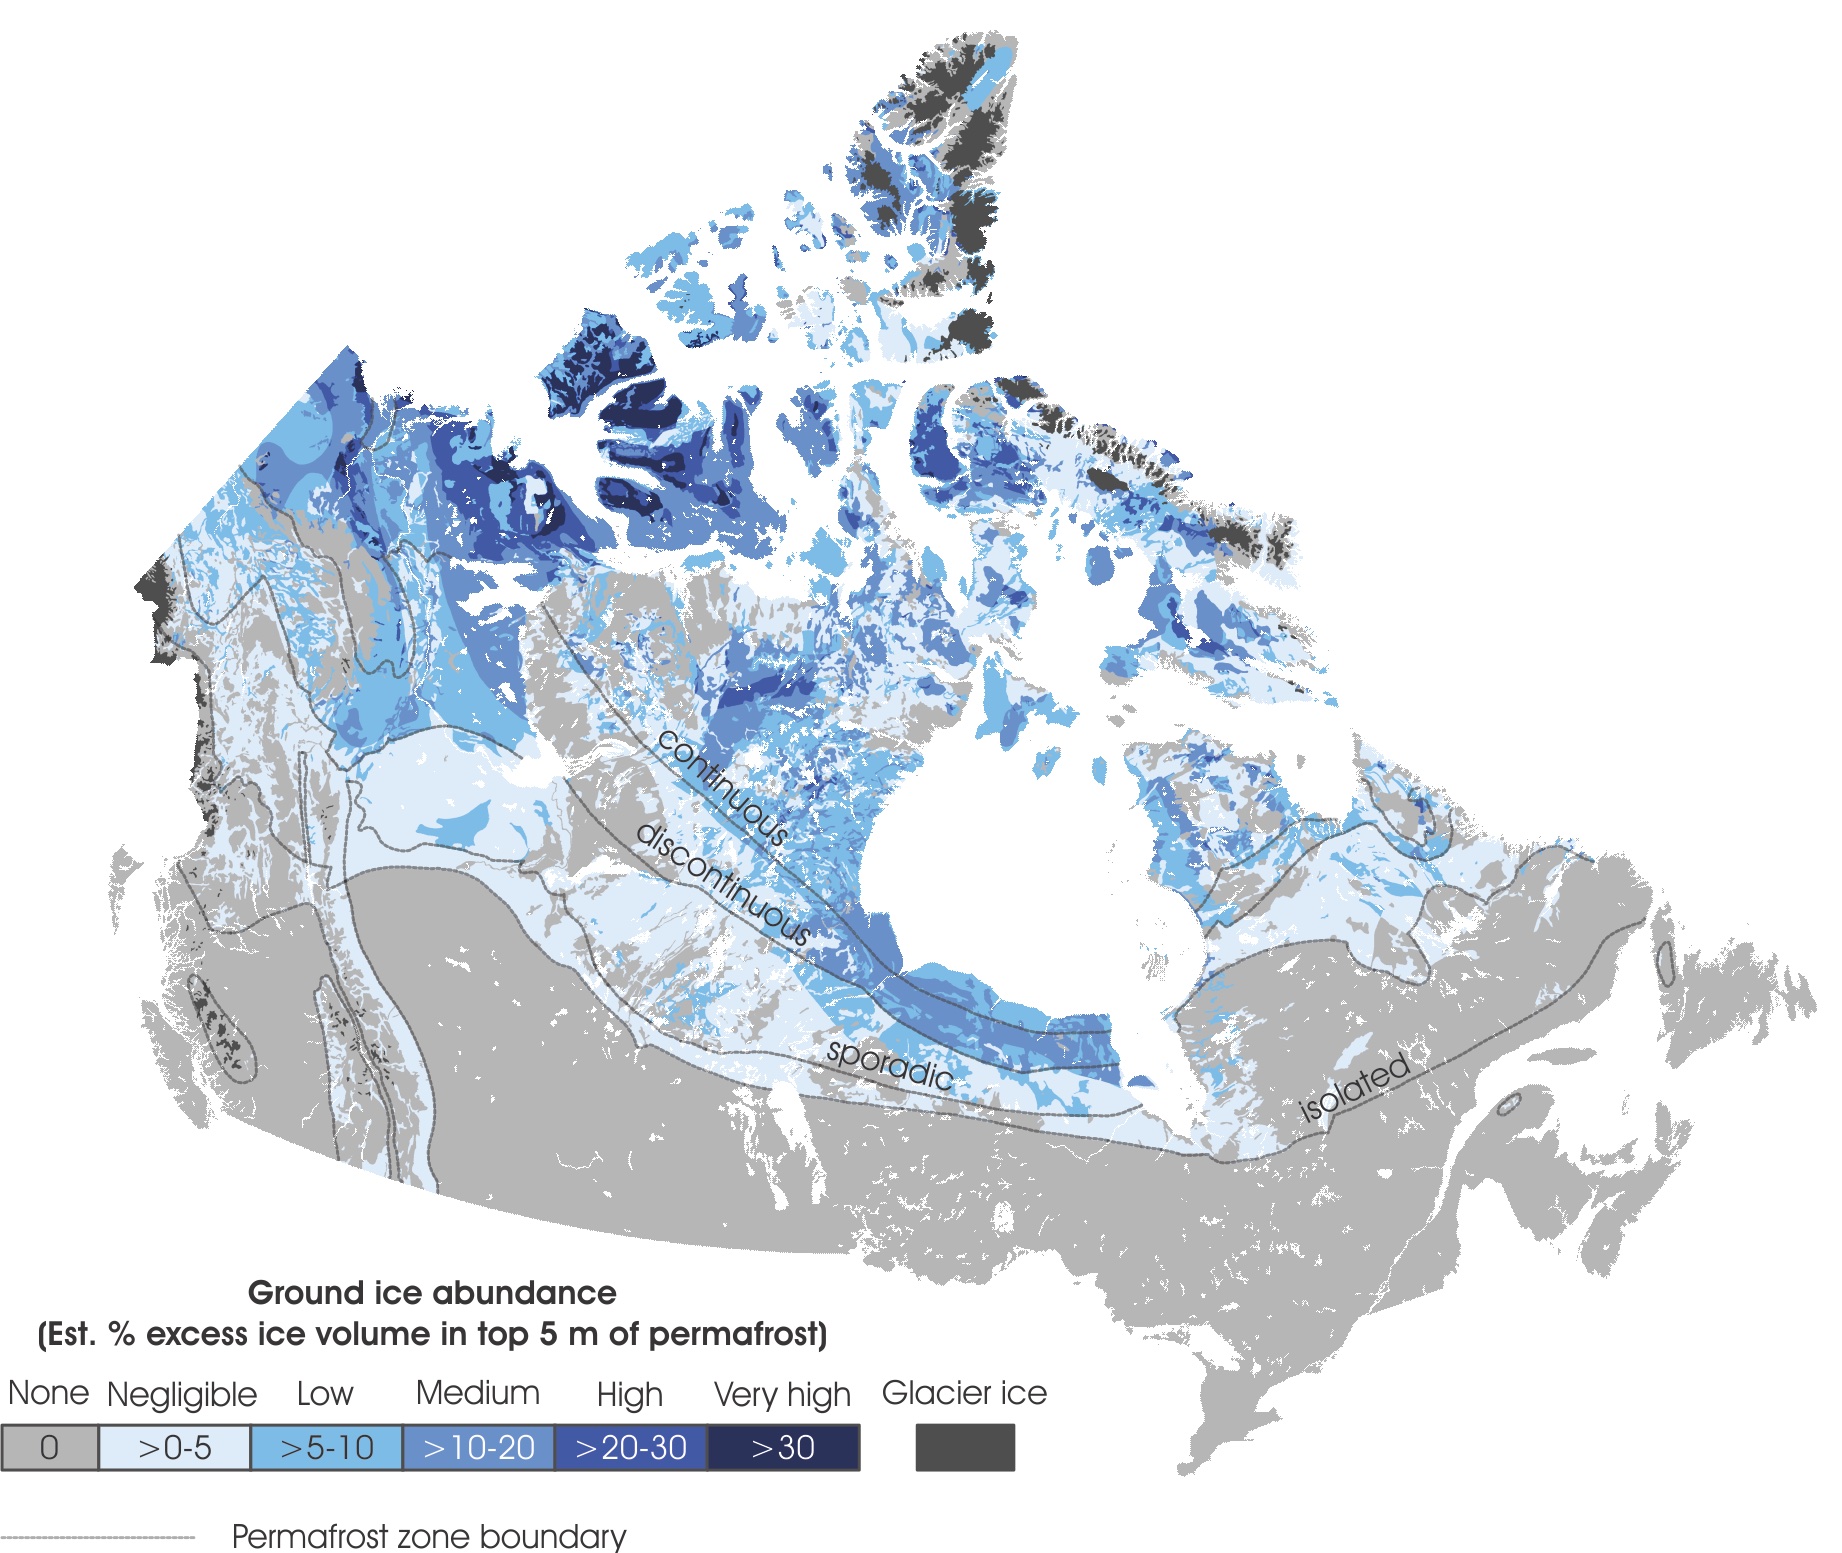
Map of Canada shaded by how much ice is held in the top five metres of permafrost, darkest across the western Arctic islands and around Hudson Bay
How much ice sits in the top five metres of permafrost. The darker the blue, the more the ground can sink as it thaws. Map: O'Neill, Wolfe and Duchesne, Geological Survey of Canada (2022).

What is actually needed

Southern monitoring tools do not survive here.

Almost everything built for environmental monitoring assumes reliable power, reliable bandwidth, road access and a technician who can drive out. None of those hold in Inuit Nunangat, where most communities have no road connection at all.

Offline first, genuinely. Field capture that works with no signal for days and syncs when it can, on a device that survives being cold.

Built for satellite bandwidth. Interfaces measured in kilobytes, not megabytes, that degrade to text rather than failing to load.

Radar over optical. Through polar darkness and near-permanent cloud, SAR is often the only instrument that works. Most monitoring platforms treat it as an afterthought.

Ground stability, not just temperature. Interferometry can detect ground moving under a building before anyone inside notices a crack.

Ice travel information owned locally. Ice conditions are safety information. Where it lives, who can see it, and who is liable for it are community decisions, not vendor settings.

Operated by people who live there. A monitoring program that depends on somebody flying in is a monitoring program that stops.

The communities

Fifty-one communities, four regions, one homeland.

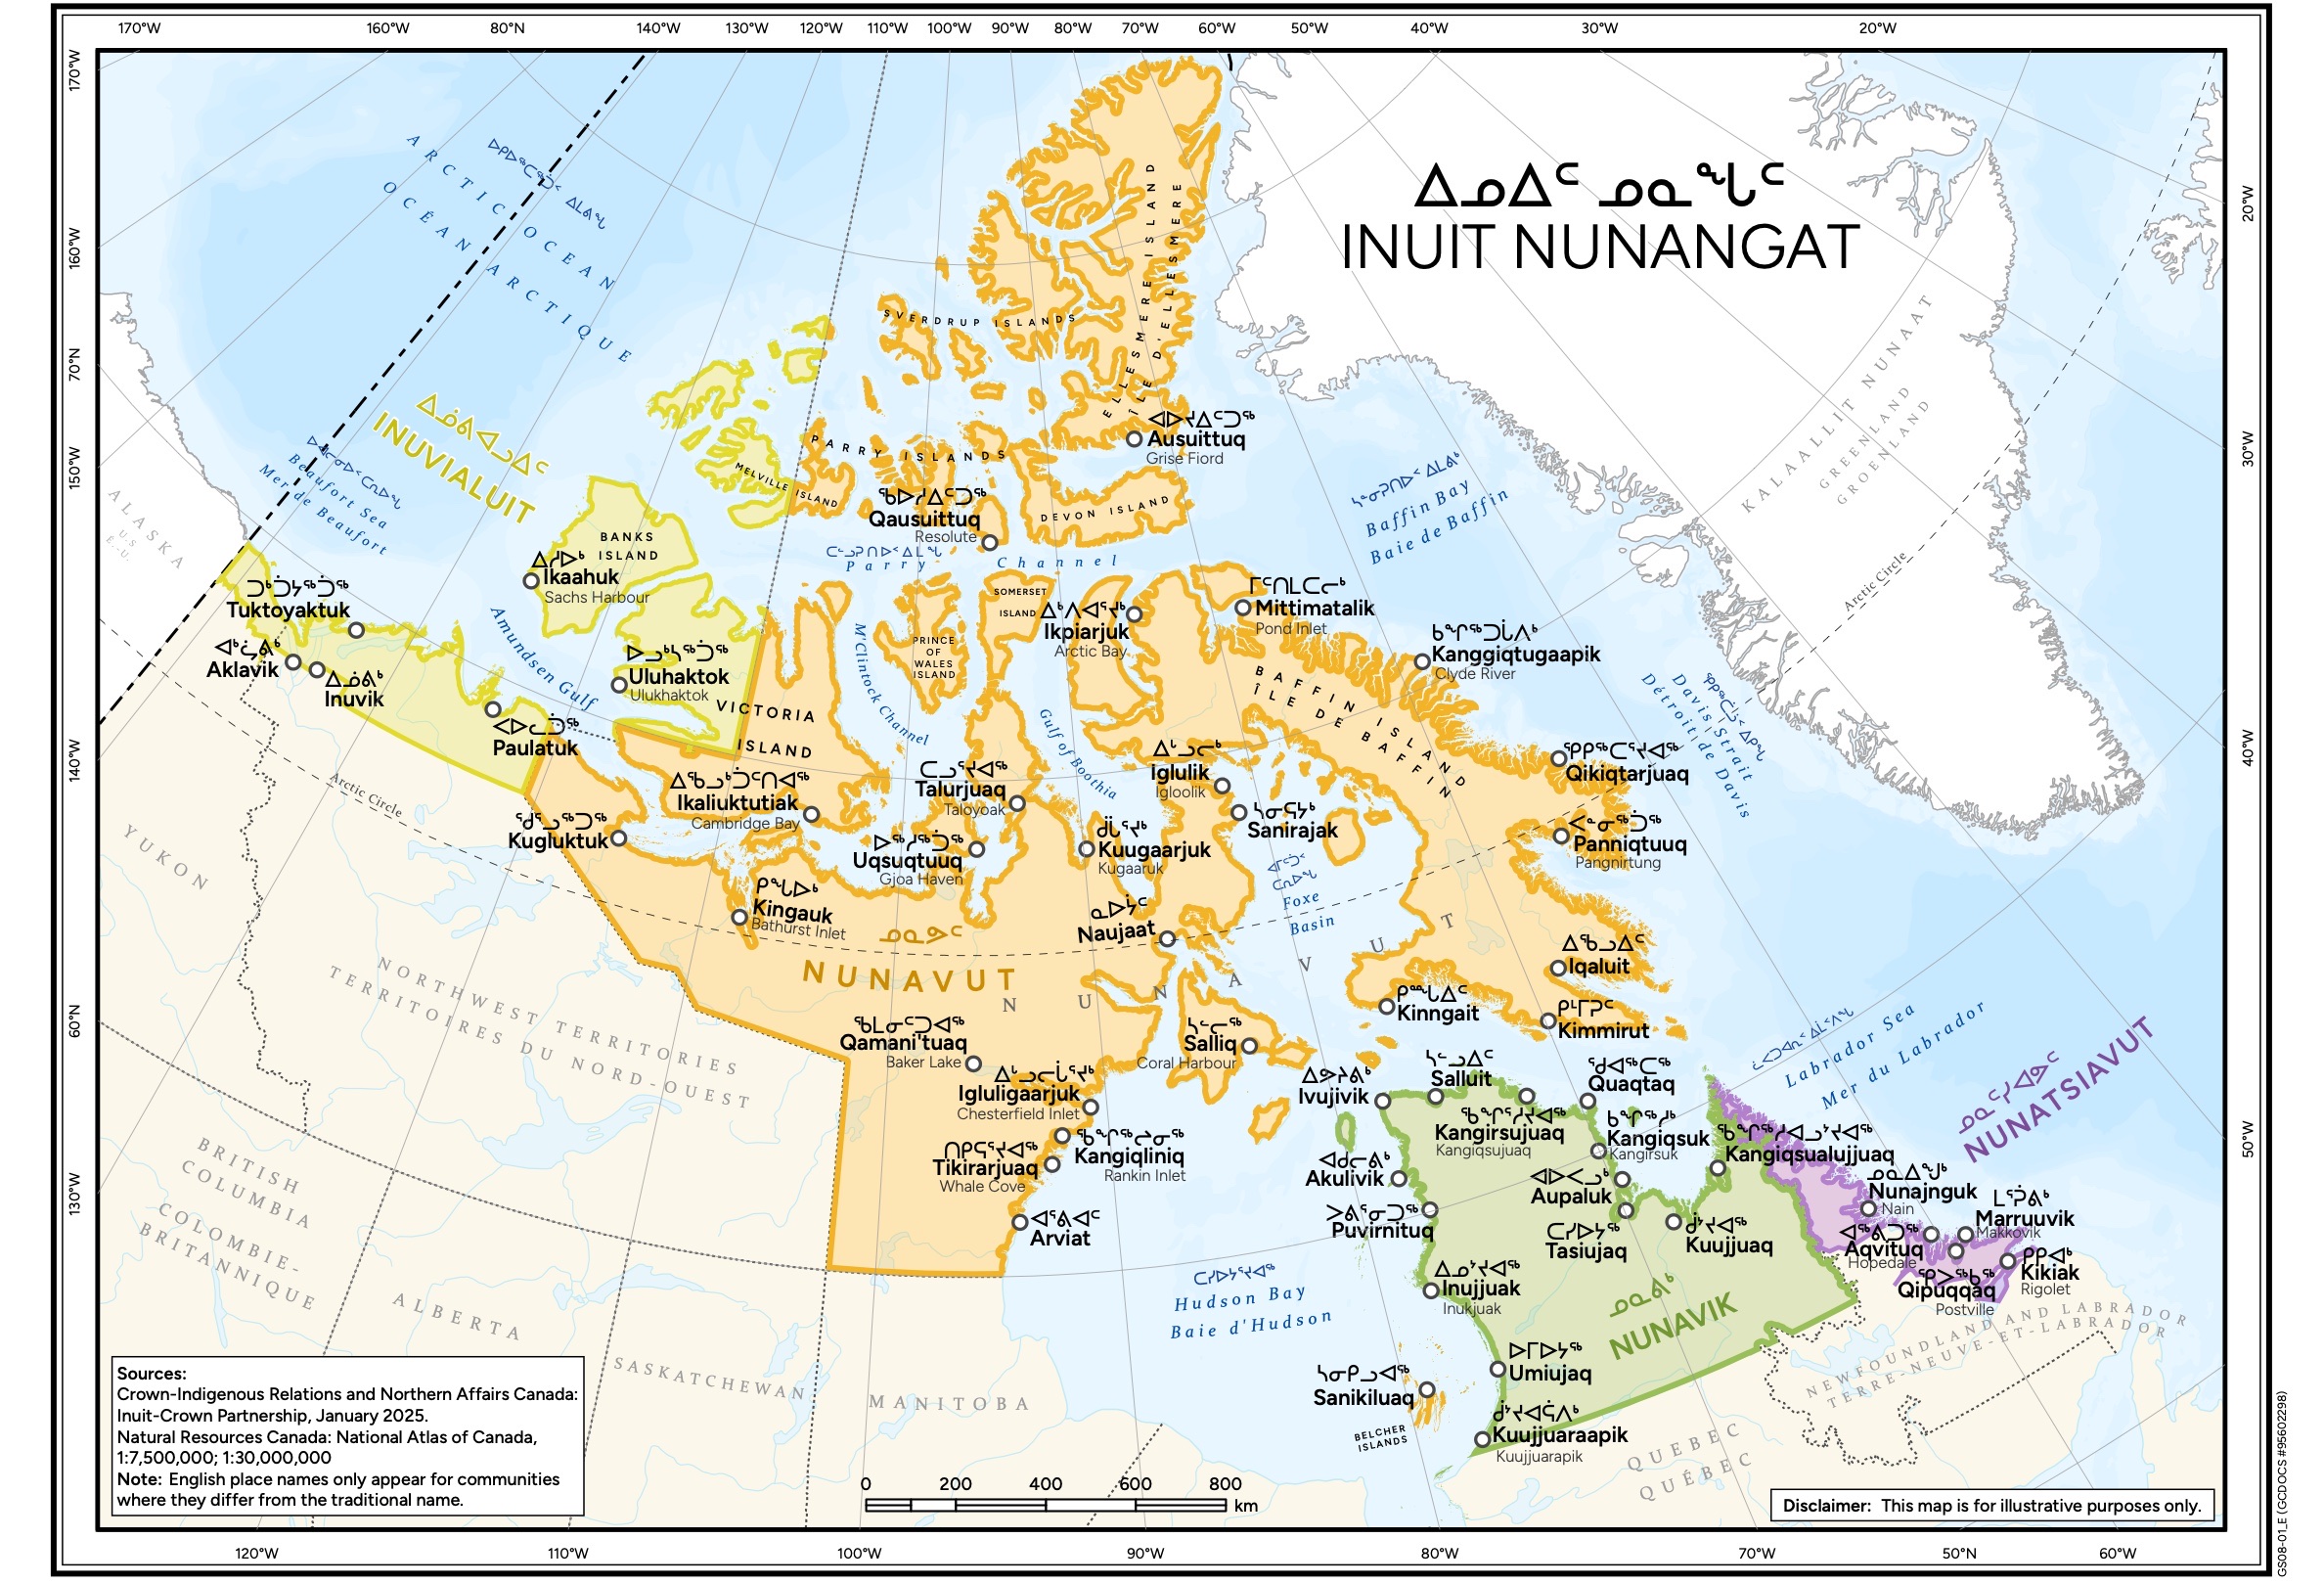
Inuit Nunangat spans the Inuvialuit Settlement Region in the Northwest Territories, Nunavut, Nunavik in northern Quebec, and Nunatsiavut in Labrador. Fifty-one communities in total, home to about 48,700 Inuit, including about 30,900 in Nunavut.

The population is young. Inuit in Nunavut and Nunavik have a median age of about twenty-two, roughly twenty years younger than non-Indigenous people in Canada. That is the single most important fact on this page for anyone thinking about how technology should be introduced here.

It means training and employment are not a nice addition to a monitoring program. They are the program. A generation is coming up right now that will spend its working life managing this change, and the useful thing to build is their capacity to do it, not a service they rent.

Map of Inuit Nunangat showing its four regions, Inuvialuit, Nunavut, Nunavik and Nunatsiavut, with every community labelled in Inuktitut and English
Inuit Nunangat: Inuvialuit, Nunavut, Nunavik and Nunatsiavut. Map: Crown-Indigenous Relations and Northern Affairs Canada (2025).

Where this stands

A case we are making, not a program we run.

We want to be straight about that. REIA has one active deployment and it is in Saskatchewan.

Everything on this page is drawn from the public record and from what northern communities and researchers have already said publicly. None of it is our finding, and no Inuit organisation has partnered with us on it.

We are publishing it because the technical case is strong, the need is documented, and the tools we are building for the prairies apply almost directly to the North with different inputs. What is missing is a community that wants it and the funding to do it properly.

If you work for an Inuit organisation, a regional government, a northern research institute or a funder with a northern mandate, that is precisely the conversation we are looking for. We would rather be told this framing is wrong by people who live there than be right on a website.

What a first step could look like. Something small and time-limited, shaped by the community from the start and aimed at whichever question matters most locally. The data would be owned and held by the community, and local people would be trained to run the work. Scope, timing and partners would be worked out together, not brought in finished.

Start that conversation

Sources for the figures on this page

  1. National Snow and Ice Data Center (2025). Arctic sea ice minimum declining 12.1 percent per decade, 1979 to 2025, relative to the 1981 to 2010 average; the nineteen lowest minimums of the satellite record all in the last nineteen years.
  2. Environment and Climate Change Canada, Canada's Changing Climate Report 2026. The Canadian Arctic warming three times as fast as the global average since 1970; some Northwest Territories coastal communities seeing erosion above 4.5 metres a year; about a month more ice-free days per degree of global warming.
  3. Environment and Climate Change Canada, Canadian Environmental Sustainability Indicators: Sea ice in Canada (2025). Summer sea ice area in northern Canadian waters declining 7.2 percent per decade, 1968 to 2024, from 2.4 percent (Kane Basin) to 15.1 percent (northern Labrador Sea).
  4. Rantanen, M. et al. (2022), Communications Earth & Environment. The Arctic as a whole warming nearly four times faster than the globe since 1979.
  5. Lewkowicz, A. G. and Way, R. G. (2019), Nature Communications. Active retrogressive thaw slumps on Banks Island, Northwest Territories, mapped from satellite imagery: 63 in 1984, a peak of 4,077 in 2013.
  6. Inuit Tapiriit Kanatami. Inuit Nunangat spanning four regions and fifty-one communities, covering forty percent of Canada's land area and seventy-two percent of its coastline.
  7. Statistics Canada, 2021 Census of Population. About 48,700 Inuit living in Inuit Nunangat, including 30,865 in Nunavut; median age of Inuit about 22 in Nunavut and Nunavik, against about 42 for non-Indigenous people in Canada.
  8. Canadian Climate Institute. Community accounts of permafrost thaw impacts on housing, roads and land-based activities in northern Indigenous communities.

Photos: sea ice, "Drift ice in Hudson Strait" by Doc Searls, CC BY 2.0. Sea ice travel, Bylot Island, by Ansgar Walk, CC BY-SA 2.5. "Dilapidated in Dawson" by Bo Mertz, CC BY-SA 2.0. Herschel Island coast by Boris Radosavljevic (Alfred Wegener Institute), CC BY 2.0. All via Wikimedia Commons. Maps as credited in their captions, NASA and Government of Canada material used under public domain and the Open Government Licence – Canada.

Further reading: Kenyon Wallace, "Beyond Frozen", Toronto Star, July 4, 2019. Source of the Iqaluit airport account above.